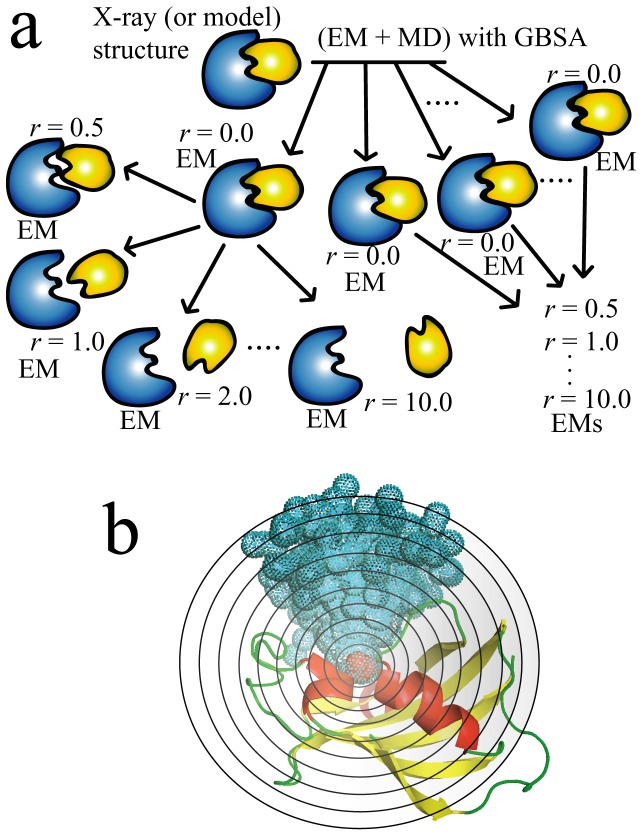
Figure 1. Schematic representation of the MRC-MMGBSA method.
(a) In the MRC-MMGBSA procedure, ligand molecules are randomly generated around a target protein with varying protein-ligand distance r and orientation. EM indicates the energy-minimization. (b) A 3D illustration of the distribution of ligand molecules randomly generated around the target protein, where the target protein is drawn by ribbon representation, and the colored spheres represent the centers of mass of the respective ligands.

