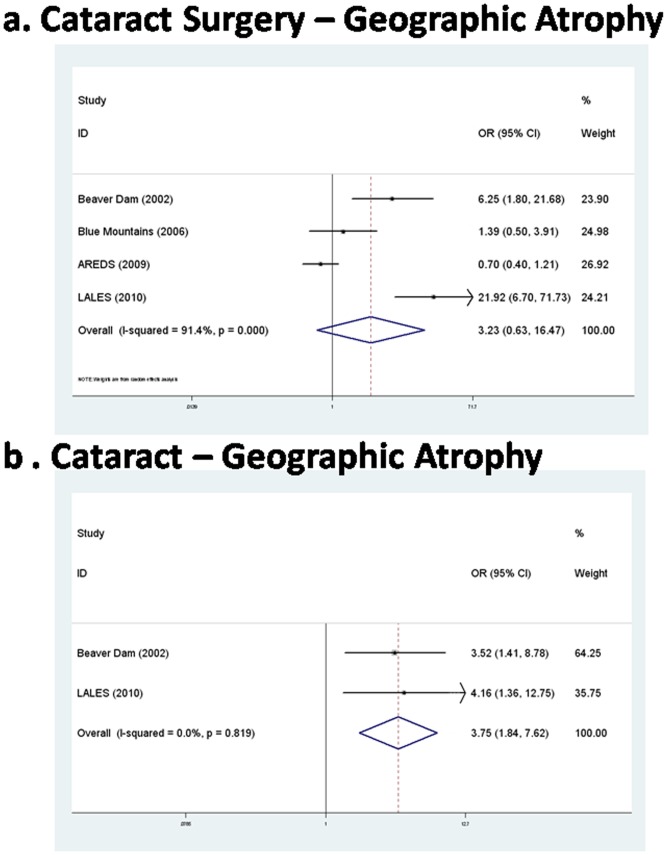
Figure 1. The forest plot of meta-analysis.
Each study is shown by the point estimate of the odds ratio (OR) (the size of the square is proportional to the weight of each study) and the 95% confidence interval (CI) for the OR (extending lines). a. the association of cataract surgery with geographic atrophy; b. the association of cataract with geographic atrophy. LALES = Los Angeles Latino Eye Study; BMES = Blue Mountains Eye Study; AREDS = Age-related Eye Disease Study.

