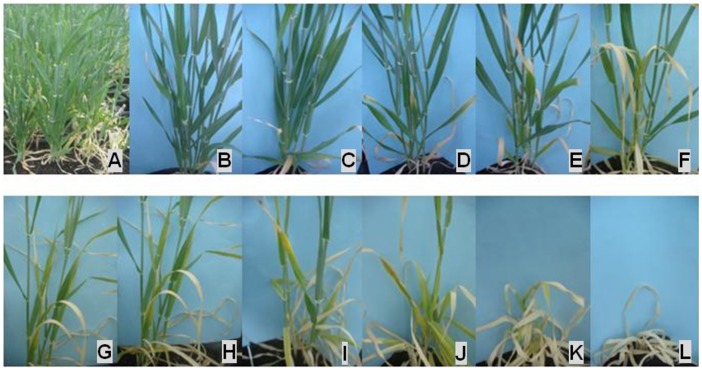
Figure 1. Range of phenotypes induced by salt stress at the booting stage in potting mixture experiment.
A: part of the whole trial showing tolerant (left and middle) and susceptible lines (right) in the same trial; B to L: lines with scores of 0 (very tolerant) to 10 (very sensitive – all dead), respectively.

