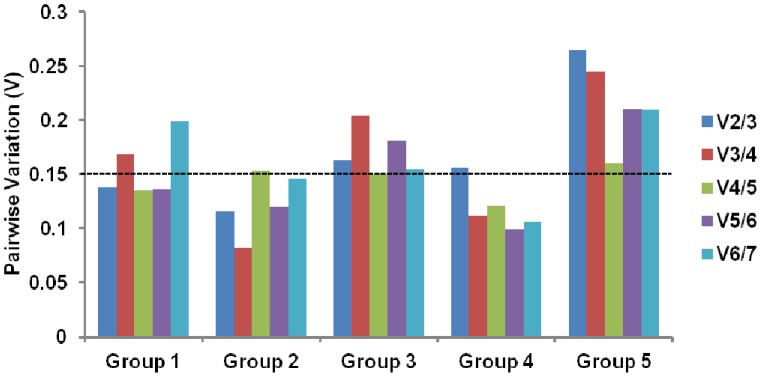
Figure 4. Pairwise variation analysis among sequential normalization factors calculated by geNorm.
Determination of the optimal number of control genes by calculation of the pairwise variation coefficient. A value from 0.15 to 0.20 was determined as an appropriate cut-off. To the right in each group, the increasing values are due to the inclusion of unstable reference genes. Group 1: E18, P1 and P4; Group 2: P1, P4 and P10; Group 3: P1, P4, P10, P14, P45; Group 4: P10, P14 and P45; Group 5: all ages.

