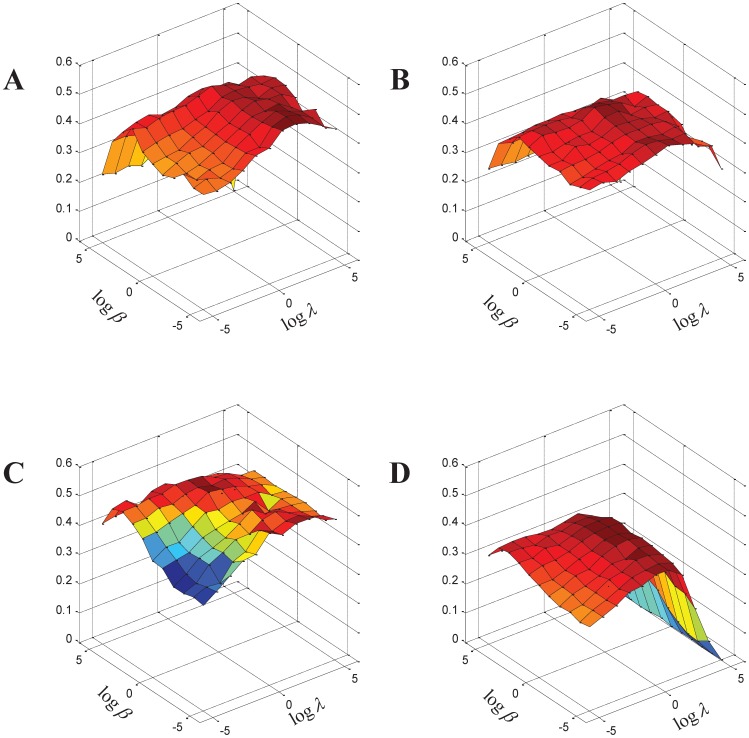
Figure 3. Performance of RSRGM on detecting complexes with respect to different values of .
 and
and
 . The x-axis denotes the value of
  , the y-axis denotes the value of
  , and the z-axis denotes the harmonic mean of the three measures scores of both MIPS and SGD reference complexes. (A) Gavin network. (B) Krogan network. (C) Collins network. (D) BioGRID network.

