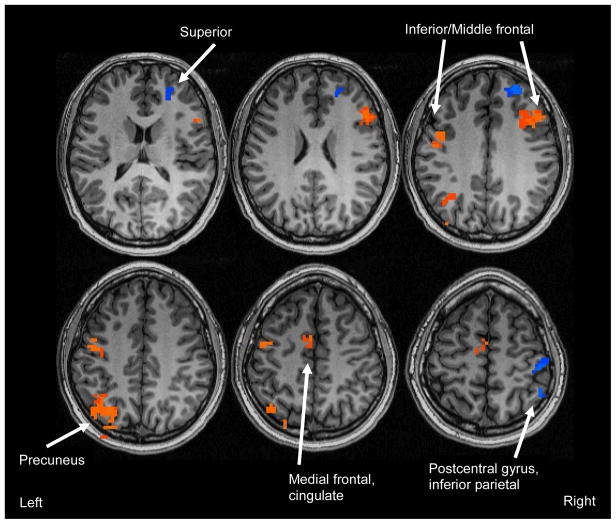
Figure 1.
Clusters showing significant main effects for binge drinking (clusters > 1512 μl, corrected p < .05). Orange indicates regions where CON and MJ (non-drinkers; n = 30) showed greater BOLD response during novel encoding than BD and BD+MJ (binge drinkers; n = 44); blue clusters represent regions where BD and BD+MJ showed greater BOLD response during novel encoding than CON and MJ.

