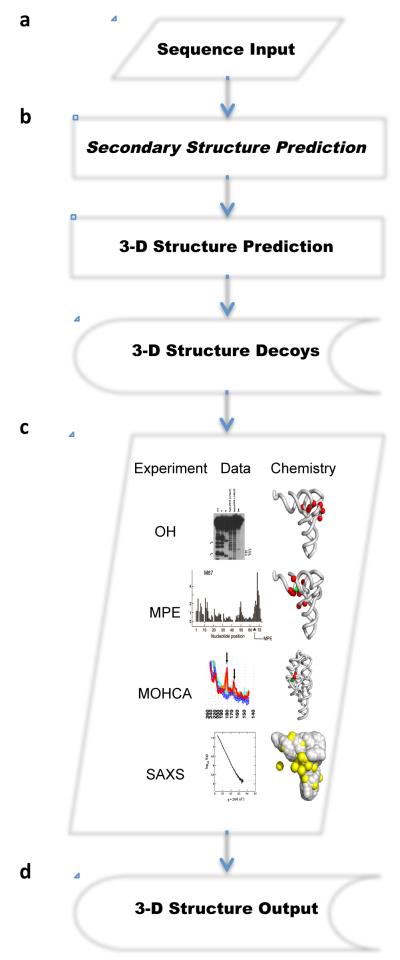
Figure 1. Steps for determining RNA 3-D structures using low-resolution data.
a) Sequence input. The input of the pipeline is an RNA sequence. b) Structure prediction. 3-D structure sets are produced using an RNA structure generator capable of simultaneously sampling the global shape and producing atomic-resolution models of the RNA input sequence. The 3-D structure generator can benefit from secondary structure prediction, which is an optional step. If used, however, then more than one secondary structure can be selected and used to produce 3-D structures. The 3-D structure sets (Decoys) represent intermediate results, but they can also be stored permanently for future use. c) Experimental data collection and filtering. The experiments may include, but are not restricted to: hydroxyl radical footprinting (OH); methidiumpropyl-EDTA (MPE); multiplexed hydroxyl radical cleavage analysis (MOHCA); and, small-angle X-ray scattering (SAXS). OH experiments show on a gel the nucleotides that are protected from cleavage upon folding. The OH data can be exploited by assessing the loss of solvent accessibility of these protected nucleotides (red spheres). MPE experiments show the cleavage intensity when the MPE agent is attached at a given position, here at nucleotide 67 in the tRNA (green sphere). MPE data can be used to estimate the distance to the MPE agent of the cleaved sites (red spheres). The distances are proportional to the cleavage intensity, which can be visualized using a histogram. MOHCA experiments result in distances between marked positions (red sphere) and the MOHCA agent (green sphere). The measured intensities are proportional to the distance between a marked position and the agent. SAXS experiments show the intensity of the scattering measured at different angles. SAXS data are convoluted and requires Fourier transforms to be converted into distance probabilities. Here, a theoretical SAXS scattering curve was generated from a tRNA 3-D model (grey spheres) and water atoms surrounding the tRNA (yellow spheres). The theoretical curve is then compared with the experimental one for congruence at all scattering angles. d) 3-D structure output. Filtering 3-D structure sets using single or combinations of experimental data results in subsets of 3-D structures that satisfy the low-resolution data. These structures can be analysed further, and submitted to energy minimization or molecular dynamics protocols for refinement.

