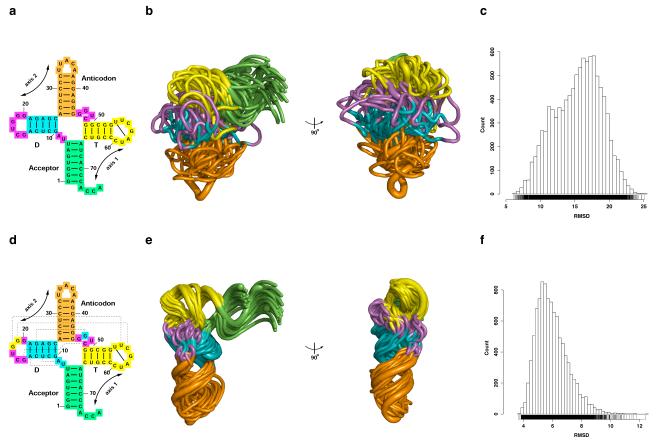
Figure 2. tRNA conformational sampling.
(Top) Low set. a) Secondary structure coloured by stems: Acceptor (green); D (cyan); Anticodon (orange); and, T (yellow). All other nucleotides are in magenta. b) Two views of twenty centroids (thin tubes) that are optimally aligned on the solution structure (PDB file 2K4C, thick tube). The colours are the same as in a. c) RMSD (Å) range (all-atoms) of the low set models computed against the tRNA experimental structure (PDB code 2K4C). (Bottom) High set. d) The secondary structure, three base triples (8-14-21, 9-12-23, and 13-22-46), and three long-range base pairs (15-48, 18-55 and 19-56) shown using dashed lines. e) Two views of twenty centroids (thin tubes) that are optimally aligned on the solution structure (PDB file 2K4C, thick tube). The colours are the same as in d. f) RMSD (Å) range (all-atoms) of the high set models computed against the tRNA experimental structure (PDB code 2K4C).

