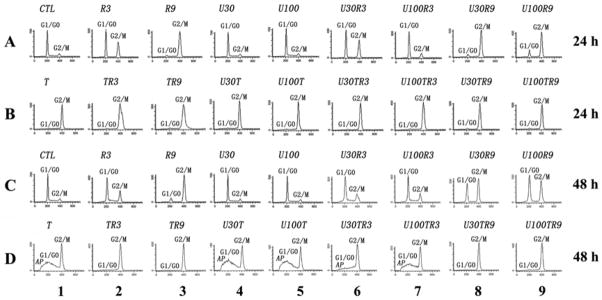
Fig. 2. Cell cycle distribution and induction of apoptosis.
BCap37 cells exposed to designated treatments were prepared for flow cytometric analysis. The peaks corresponding to G1/G0 and G2/M phases of the cell cycle are indicated. The sub-G0/G1 peaks labeled as AP represent the population of apoptotic cells. CTL, control; R, radiation; U, UCN-01; T, 50 nM of paclitaxel. The numbers after R, U and T indicate the dosages tested (Gy for radiation; nM for drugs).

