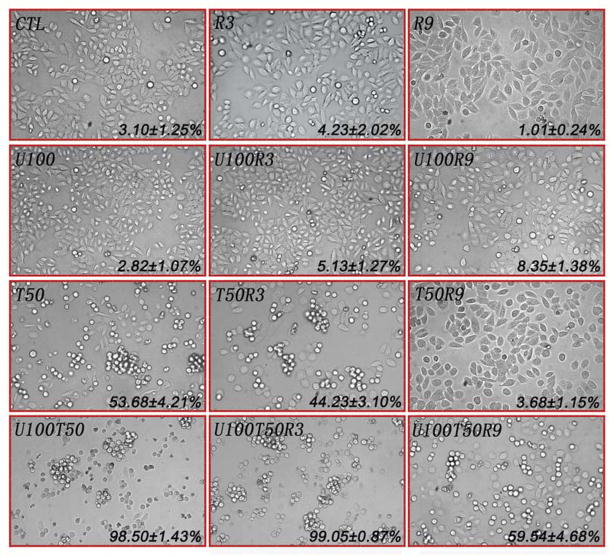
Fig. 3. Morphological examination with light microscopy and quantitative analysis of mitotic arrest.
After exposure to designated regimes for 24 h, BCap37 cells were examined using a phase contrast microscopy. Cells that appear bright, rounded and detached from the dish are mitotic cells. The data (Mean±S.D.) marked in each photo indicate the ratios of mitotic cells in corresponding groups. CTL, control; R3 and R9, 3 and 9 Gy of radiation, respectively; U100, 100 nM of UCN-01; T50, 50 nM of paclitaxel. Magnification, ×40

