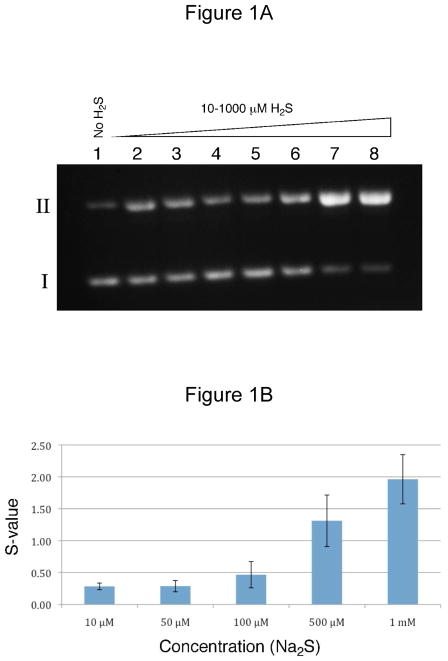
Figure 1. DNA strand cleavage by H2S.
Strand cleavage assays were performed as described in the Experimental Section. Briefly, supercoiled double-stranded plasmid DNA (pGL2-Basic, 1 μL of a 1 mg/mL solution in 10 mM Tris-HCl, 1 mM EDTA, pH 7.5) was added to water (17 μL), followed by addition of sodium sulfide nonahydrate (2 μL in sodium phosphate, pH 7, 500 mM). After12 h incubation, Form I and II plasmid DNA were resolved on an agarose gel and stained with ethidium bromide. The DNA was visualized by UV-transillumination and the amounts measured by digital image analysis. The number of single strand breaks per plasmid DNA molecule (S) was calculated using the equation S = −ln f1 where f1 is the fraction of plasmid present as form I.97 Panel A. Treatment of plasmid DNA with H2S led to an increase in the amount of cleaved, form II DNA. Lane 1 contained plasmid with no H2S while lanes 2–8 contained 10, 25, 50, 100, 250, 500, and 1000 μM H2S, respectively. Panel B. A plot of strand cleavage yields (S) versus H2S concentration. Here the yields of strand cleavage were corrected for the amount of form II plasmid present in untreated plasmid DNA (lane 1).

