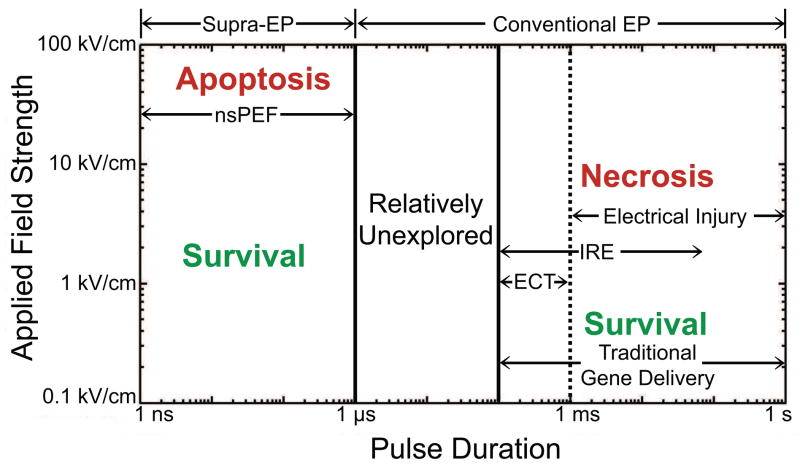
Figure 1. Map of the approximate locations of effects and applications due to cell electroporation (EP) in pulse strength-duration space.
The two-dimensional log-log display indicates approximate regions with well established effects and applications. This simple map is therefore a rough guide to much, but certainly not all, EP effects and applications. The vertical position of a label indicates an approximate, associated applied field strength (|Eapp|, magnitude), and the horizontal position of a label indicates a characteristic range of pulse duration. Each phenomenon or application is described briefly in subsections below. The purpose of this figure is to direct attention to a “big picture” of EP, its effects, and applications. Particular attention is directed to the “Relatively Unexplored” region between 1 and 100 μs, where additional intracellular EP effects are expected.

