Figure 1.
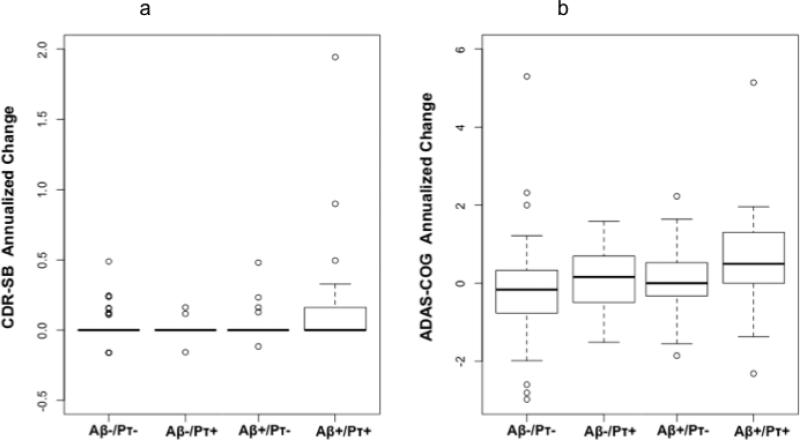
Box and whisker plots for all participants illustrating change in (a) CDR-SB and (b) ADAS-cog scores, measured as annualized percent change (APC), based on CSF Aβ1-42 (Aβ) and CSF p-tau181p (pτ) status. For each plot, thick black lines show the median value. Regions above and below the black line show the upper and lower quartiles, respectively. The dashed lines extend to the minimum and maximum values with outliers shown as open circles. As illustrated, the Aβ +/pτ + individuals demonstrated the largest change in CDR-SB and ADAS-cog scores.

