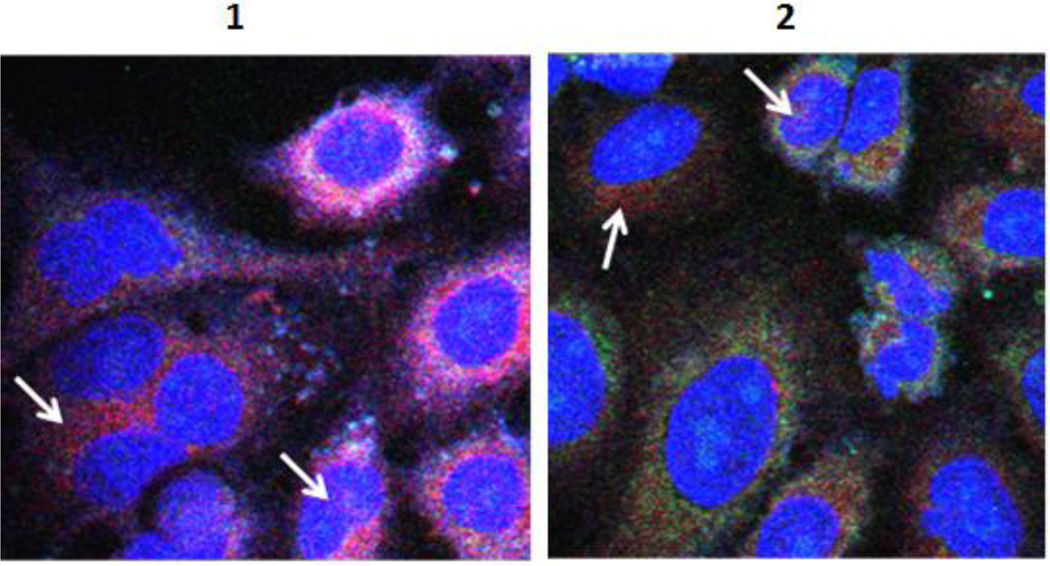
Figure 3.
Subcellular distribution of 1 and 2 at 16 h of incubation. Fluorescent probes were excited (at 488 nm, 633 nm and 755 nm) and two-dimensional confocal images acquired by scanning a field at 2 µs per pixel. Each image shows overlay of nuclear stain (blue), mitochondrial stain (green) and cypate (red). Arrows point to cypate fluorescence indicative of the presence of the compound in the marked region.

