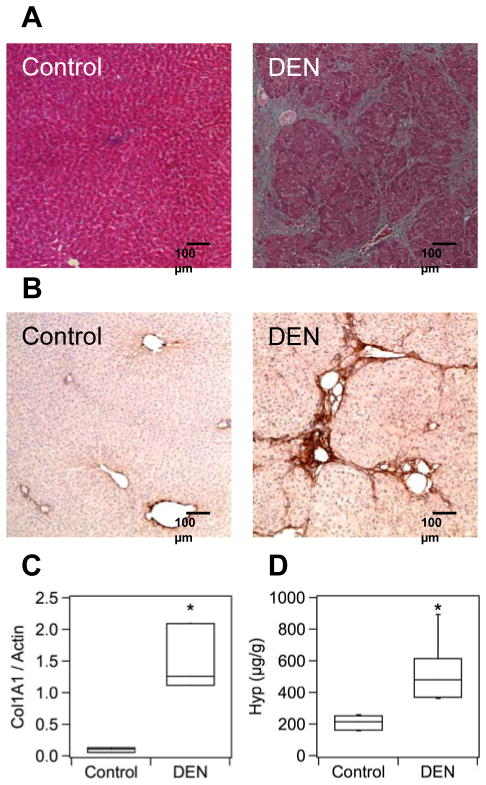
Fig. 1. Characterization of fibrosis and collagen deposition in the rat DEN model.
(A) Masson’s trichrome staining reveals numerous portal fibrotic expansions in the DEN sample corresponding to advanced fibrosis, Ishak 5 in this example. There is no detectable fibrosis in the control sample. (B) Immunostaining for type I collagen in liver shows rich staining in the DEN treated animals but is absent in the controls. (C) Expression of liver α1(I) procollagen mRNA was 15-fold higher (* p <0.05) in the DEN treated group compared to controls. (D) Total liver collagen (as hydroxyproline) is 2.5-fold higher in DEN treated animals compared to controls (* p <0.05). Box plots in Panels (C) and (D) illustrate median (line inside box), interquartile range (box), and minimal and maximal (lines extending above and below box) values.

