Fig. 2.
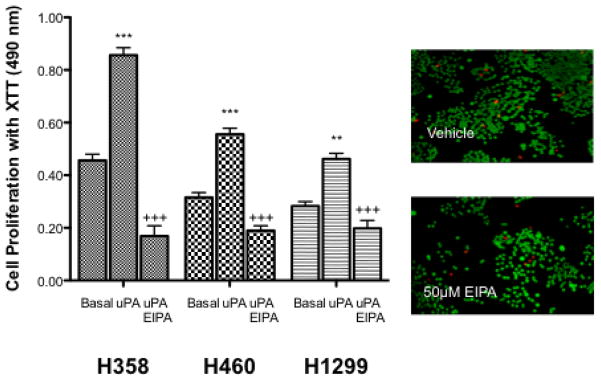
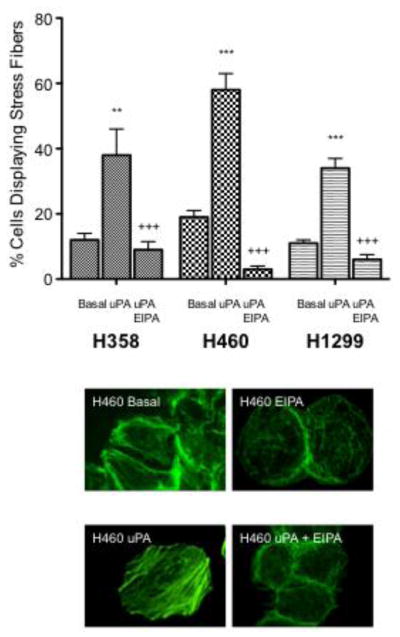
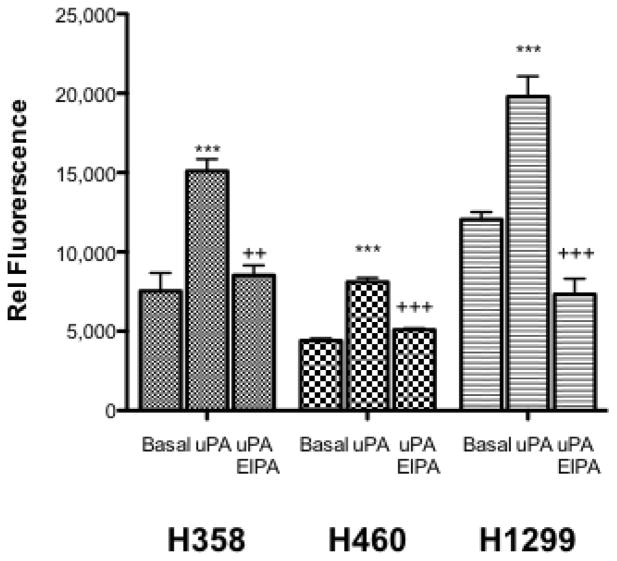
uPA and NHE1 influence cell proliferation, motility and tumor growth. Where indicated cells were treated with 10 nM uPA in the absence or presence of 10 nM EIPA. A. Cell proliferation of three cell lines was determined using the XTT assay. Cells (1 × 10³/well) were seeded, allowed to attach for one day and then incubated overnight in low serum medium alone or in the presence of the indicated agonist or inhibitor for 24 hours. All data are presented as the mean +/− SEM (n ≥ 8). Inset – a live-dead assay was performed in parallel with a high dose (50 μM EIPA). Green cells indicated living cells while red cells identify apoptotic cells. B. Cells were grown to 20–30% confluency on glass coverslips and cultured 12–16 hours in media containing 0.5% serum. The cells were then deprived of serum for 1 h. Agonist alone or in combination with EIPA was added and cells were incubated at room temperature for 30 min and stained for actin polymerization. Five random fields were counted for each coverslip. The average percent of cells displaying stress fiber formation was determined for each field in each experiment. Representative micrographs were obtained by using an Olympus IX70 fluorescence microscope. C. Cells were suspended in 0.6% agar saturated with RPMI medium containing 0.5 FBS. Cell plugs were incubated at 37° C for 9 days with the indicated agonist or inhibitor. Following the incubation period, the agar was suspended, cells solubilized and quantitated by CyQuant-DNA analysis. Data are presented as the mean ± SEM (n=4). Statistical analysis was performed using a non-paired one-way Anova (p>0.001) as compared to each cell type control sample group.


