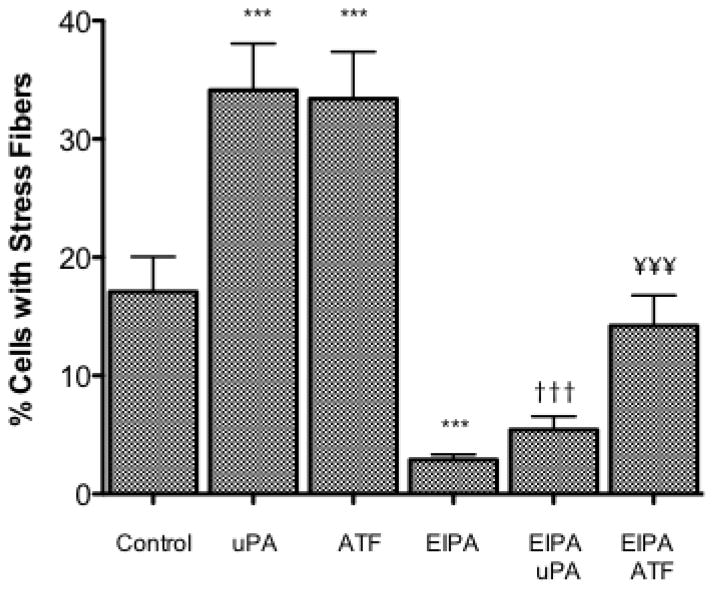
Fig. 5.
H460 Stress Fiber Formation. H460s were grown to a 30–50% confluency on a glass cover slip. After being placed in 0.5% serum overnight H460 cells were serum deprived and stimulated 10nM uPA or ATF without and with 10 μM EIPA 15 minutes prior to stimulation. Five random fields were examined for each cover slip and the average percent of cells expressing stress fibers determined for each field. Data indicated with a *** were significantly different from the control data using a one-way Anova with Tukey’s Multiple Comparison with a 99.9% confidence interval (P-value of < 0.001). Data indicated with ††† and ¥¥¥ were compared for the corresponding agonist alone vs. the agonist and inhibitor treatment.

