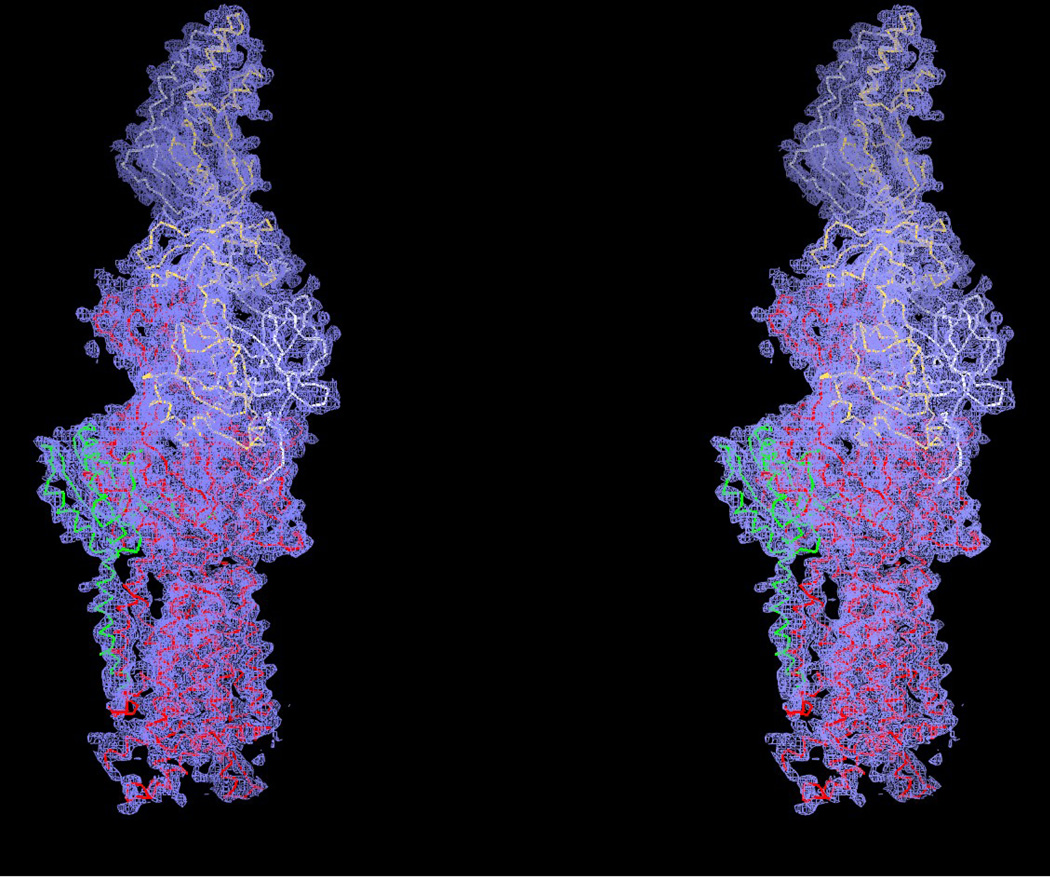
Figure 1.
Stereo view of the electron density map at a resolution of 3.45 Å. This is a 2Fo – Fc electron density map (blue mesh) contoured at 1.0 σ. The Cα traces of residues 664-717 and 814–888, showing a distinct conformation of the structure of form Ia are in green. The Cα traces of form Ib of CusA, and molecules 1 and 2 of CusB are in red, white and yellow, respectively.

