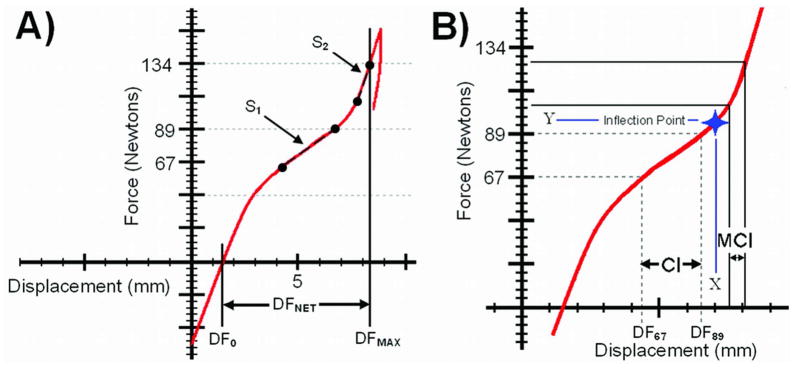
Figure 2.
A) A representative illustration of S1, the slope of the linear region in the first quadrant after an initial decrease in stiffness from the posterior-to-anterior force transitional region, and S2, the slope of the linear region in the first quadrant after an increase from S1, as well as DFnet, DF0, and DFmax. Linear stiffnesses S1 and S2 are determined by the slope of a line of best fit for all points between visually identified starting and ending points of linearity. B) A typical example of the AP displacement (mm) at which the transition from S1 to S2 occurs (X) and the force (N) at which that transition occurs (Y). Together, these coordinates make up the Inflection Point. Also shown is the difference between the traditionally defined Compliance Index (CI) and the Modified Compliance Index (MCI).

