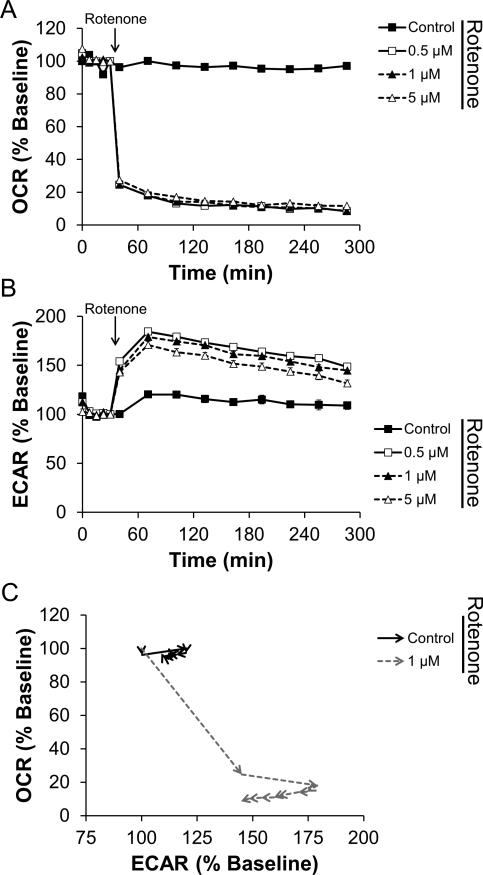
Figure 3. Rotenone rapidly induces a shift towards glycolytic metabolism.
N27 cells were seeded and treated as described in Figure 2. The indicated concentration of rotenone was injected after 5 baseline OCR and ECAR measurements, and OCR (Panel A) and ECAR (Panel B) were monitored for an additional 4 h. As in Figure 1, data in Panel C are taken from the cells treated with 1 μM rotenone or left untreated. Arrowheads indicate the progression in time. For clarity, the first 4 baseline measurements and statistical significance is omitted from data in Panel C. Data shown are the mean ± sem. n=5 per treatment group.

