Fig. 5.
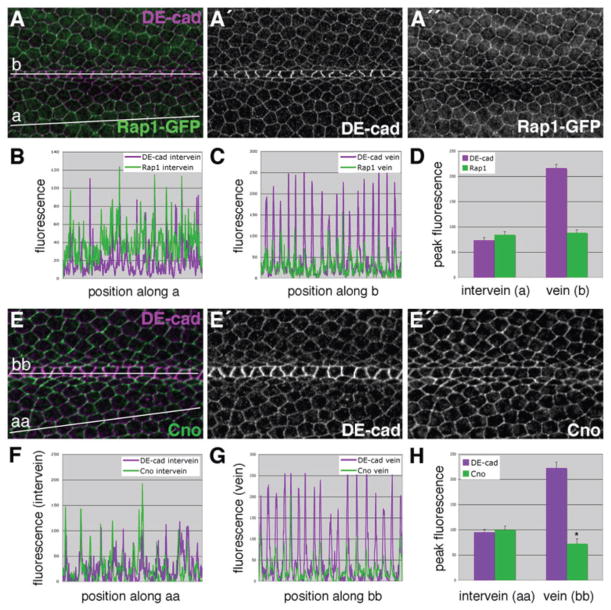
Relative to DE-cad, levels of both Rap1 and Cno are reduced at vein-vein cell junctions.(A) Wings from Rap1-GFP animals were dissected at 36 h APF and labeled for DE-cad. For both DE-cad and Rap1-GFP, fluorescence intensity was measured along two vectors: intervein (a), and vein (b). Raw data is plotted for intervein (B) and vein (C) cells. (D) Fluorescence values specifically from cell-cell junctions were extracted to more quantitatively compare fluorescence (See Supp. Fig. S5). Significantly more DE-cad localizes to vein-vein cell junctions than intervein-intervein cell junctions. In contrast, vein and intervein cell junctions contain similar levels of Rap1-GFP. (E) A 36-h APF wild-type wing double-labeled for DE-cad and Cno. For both DE-cad and Cno, fluorescence was measured along two vectors, intervein (aa) and vein (bb). Raw data (F,G) and peak values (H) are plotted. Analysis indicates that at vein-vein cell junctions DE-cad levels are higher, while Cno levels are slightly lower (compared to intervein values). Error bars indicate SEM. *p • 0.05 when compared to the corresponding intervein Cno value via the Student’s t-test. Note that y-axis scales are not identical between panels.

