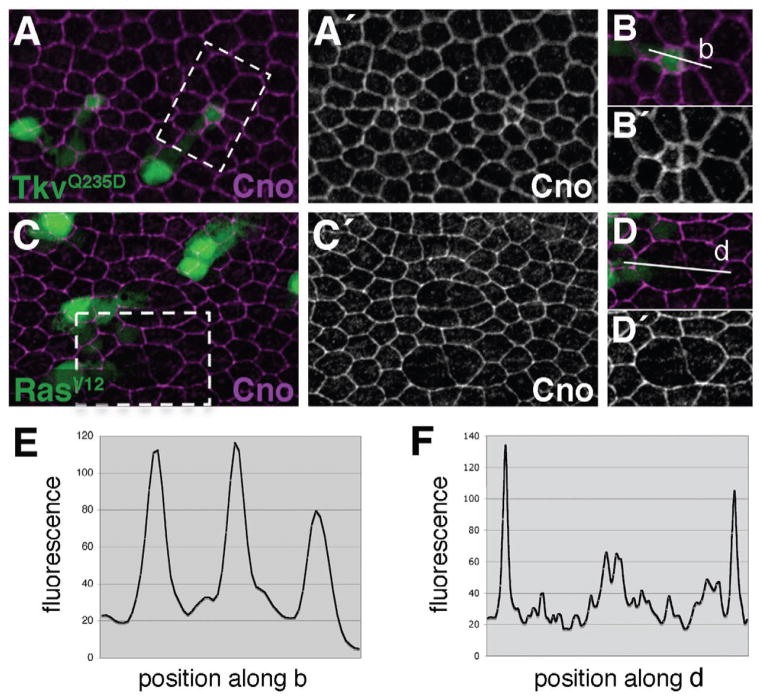
Fig. 7.
Ras signaling regulates Cno levels. Clones expressing either TkvQ235D (A,B), or RasV12 (C,D) were generated at 0 h APF. Wings were dissected at 36 h APF and labeled for Cno. (B) and (D) represent magnified views of boxed regions in A and C, respectively. (A) TkvQ235D-expressing cells are apically constricted, but Cno levels are not dramatically affected compared to surrounding wild-type tissue. (C) In contrast, Cno levels are down-regulated in RasV12-expressing cells. (E) and (F) indicate fluorescence intensity values measured along vectors (b) and (d), respectively. (E) Cno remains essentially evenly distributed about the apicolateral circumference of TkvQ235D-expressing cells. (F) In contrast, Cno levels are dramatically lower at junctions between RasV12-expressing cells. Note that y-axis scales are not identical between panels.

