Fig. 1.
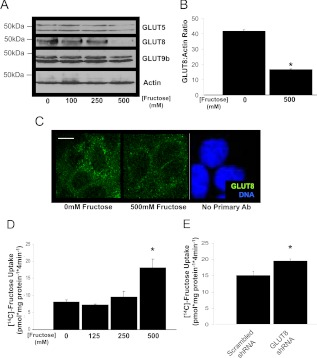
Caco2 cell fructose exposure suppresses GLUT8 abundance and stimulates fructose uptake. A, Fructose exposure decreases Caco2 GLUT8 protein abundance. Caco2 cultures were incubated with or without d-fructose (48 h), lysed, and immunoblotted for GLUT5 (upper panel), GLUT8 (second panel), GLUT9b (third panel), and actin (bottom panel). B, Quantification of GLUT8:Actin band intensity by ImageJ densitometry. *, P < 0.05 vs. 0 mm group. C, Intracellular localization of GLUT8. Confocal images of Caco2 cultures treated with or without 500 mm d-fructose for 6 h and immunolabeled with GLUT8 primary antibody are shown. Cultures incubated without primary antibody are shown at right. Scale bars, 10 μm. Green represents GLUT8 signal. Blue represents nuclear staining. D, Fructose exposure stimulates Caco2 fructose uptake. Caco2 cells were incubated with or without fructose and radiolabeled fructose uptake was measured. *, P = 0.019 vs. 0 mm group. E, shRNA-mediated GLUT8 knockdown stimulates Caco2 fructose uptake. Caco2 cultures were transfected with lentivirus encoding scrambled shRNA or with virus encoding GLUT8 shRNA before measurement of radiolabeled fructose uptake. *, P < 0.05 vs. scrambled shRNA group. Ab, Antibody.

