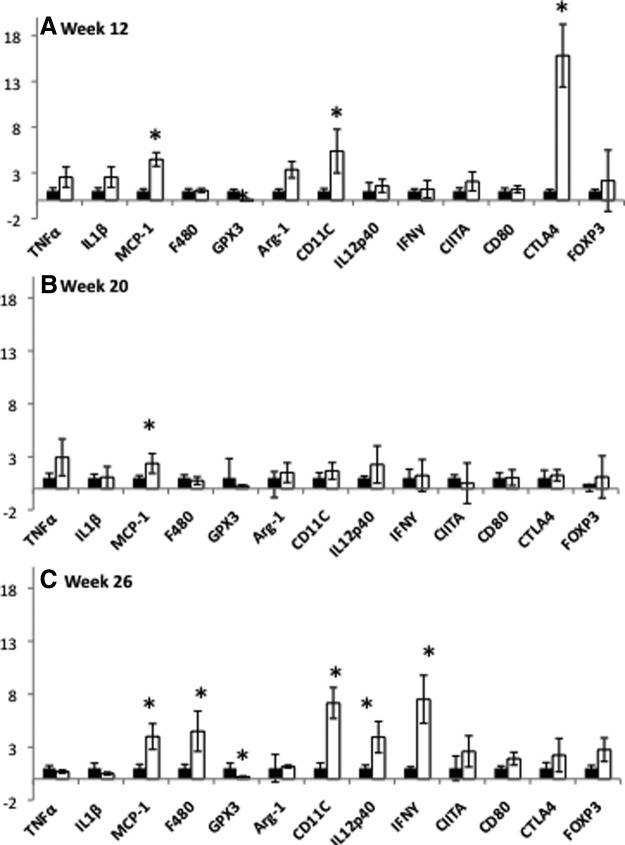
Fig. 6.
Comparison of adipose tissue gene expression between OVX and SHM mice at 12, 20, and 26 wk after surgery reveals profound immune cell activation in OVX mice at 26 wk. AAT mRNA expression relative to SHM mice is shown at 12 wk (A); AAT mRNA expression relative to SHM is shown at 20 wk (B); AAT mRNA expression relative to SHM is shown at 26 wk (C). Black columns, SHM mice; white columns, OVX mice; error bars indicate sem (n = 6–10/group). *, P < 0.05 between groups within the time point.

