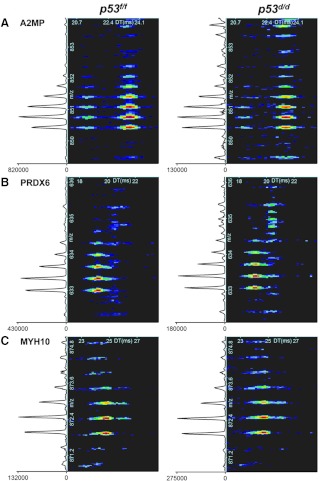
Fig. 1.
IMS-MS spectra of A2MP, PRDX6, and myosin-10 (MYH10) peptides. A, YIFIDESHITQALTWLSQQQK from A2MP. B, LIALSIDSVEDHLAWSK from PRDX6. The signal intensity located at the bottom left of each spectra denotes an increase in peptide intensity in the p53f/f samples by 6.3- and 2.4-fold change for these A2MP and PRDX6 peptides, respectively. C, IMS-MS spectra for the significant peptide QLLQANPILESFGNAK from MYH10 showed a 2.1-fold intensity increase in the p53d/d sample. Mouse identifiers WT_8718 and KO_7988 (see Supplemental Tables 1–9) were used as examples for this figure.

