Fig. 1.
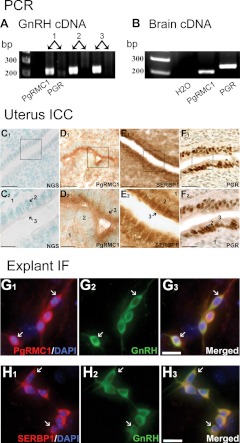
PgRMC1 and SERBP1 are expressed in GnRH neurons. PCR on cDNA from three single-cell GnRH neurons maintained in nasal explants shows bands of appropriate size for PgRMC1 but not PGR (A). Controls, Adult mouse brain cDNA shows bands for both PgRMC1 and PGR (B). A ×40 bright-field images of mouse uteri sections (C–F) used as a positive control for PgRMC1, SERBP1, and PGR ICC/IF staining. In panels C1–F1, the box represents the ×100 field shown in C2–F2; 1, Endometrial stroma, 2, endometrial glands, and 3, epithelium of the endometrium. GnRH neurons in explants express PgRMC1 (G1–G3) and SERBP1 (H1–H3). Scale bars, 25 μm in panels C1–F1; 10 μm in panels C2–F2; 5 μm in panels G and H. DAPI, 4′,6′-Diamino-2-phenylindole.

