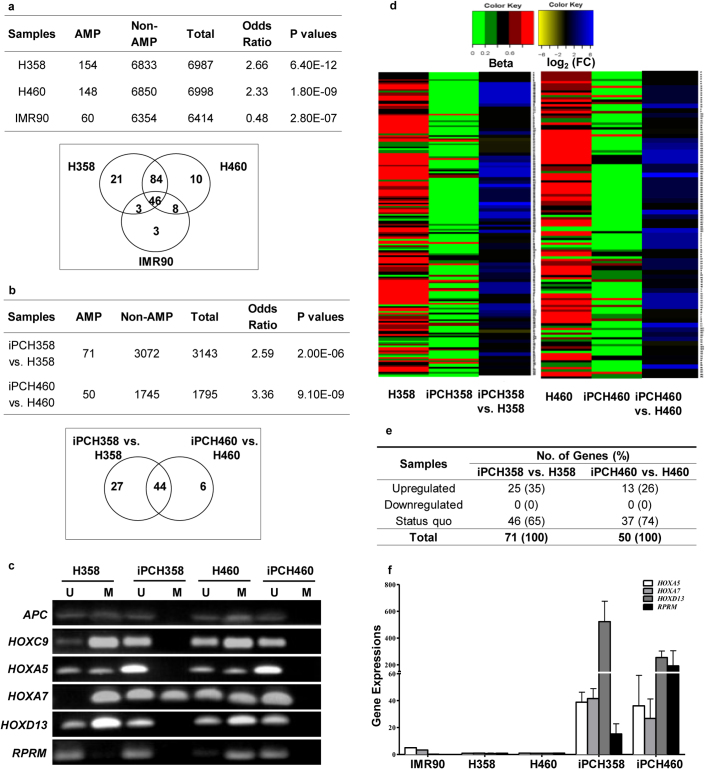
Figure 4. Fate of AMPs upon direct reprogramming of lung cancer cells.
(a) Table and Venn diagram showing the number of identified AMPs methylated in H358, H460 and IMR90. P-value and odds ratio (OR) was calculated using Fisher's exact test against the expected background; OR>1: over-representation, OR<1: under-representation. (b) Table and Venn diagram illustrating the number of identified AMPs that are hypomethylated in iPCH358 and iPCH460. Fisher's exact test was used to calculate P-value and OR. (c) MSP analyses further verified the methylation status of AMP genes extracted from the array. (d) Heat map representing all hypomethylated AMPs identified in (b). Methylation pattern is depicted in green (unmethylated) and red (methylated). Adjacently, the gene expression patterns showed here in yellow (downregulated) and blue (upregulated) illustrate gene upregulation in iPCs upon hypomethylation. (e) Quantification of the number of genes upregulated, downregulated or status quo among all hypomethylated AMPs in iPCH358 and iPCH460. (f) qPCR on HOX gene clusters and other AMPs corroborated with the gene expression data. The mRNA expression was normalized to GAPDH mRNA expression. Data are presented as mean ± SD.

