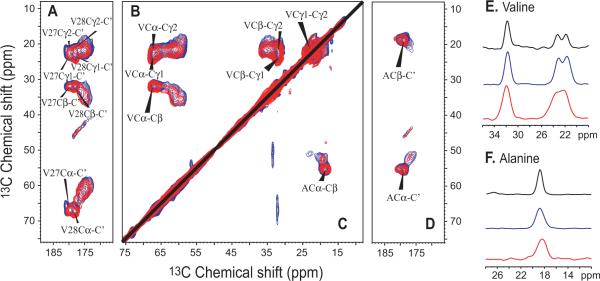
Figure 1.
Comparison of 13C-13C correlation spectra using 50 ms mixing time at 243K of uniformly [13C,15N]-valine (A,B,E,) and uniformly [13C,15N]-alanine (C,D,F,) labeled M2FL in reconstituted liposomes at pH 7.5 (blue) and in E. coli membranes at pH 8.0 (red). (A,D) Cα, Cβ, Cγ1, and Cγ2 correlations with C' for valine and Cα, Cβ correlations with C' for alanine labeled samples. (B,C) Correlations between Cα, Cβ, Cγ1, and Cγ2 for valine and Cα-Cβ correlations for alanine labeled samples. (E) Spectral slices at 67.3 ppm through the valine resonances from M2CD (black), M2FL reconstituted (blue), and M2FL in situ (red) samples. Spectral slices at 55.5 ppm through the alanine resonances from M2CD (black), M2FL reconstituted (blue), and M2FL in situ (red) samples.

