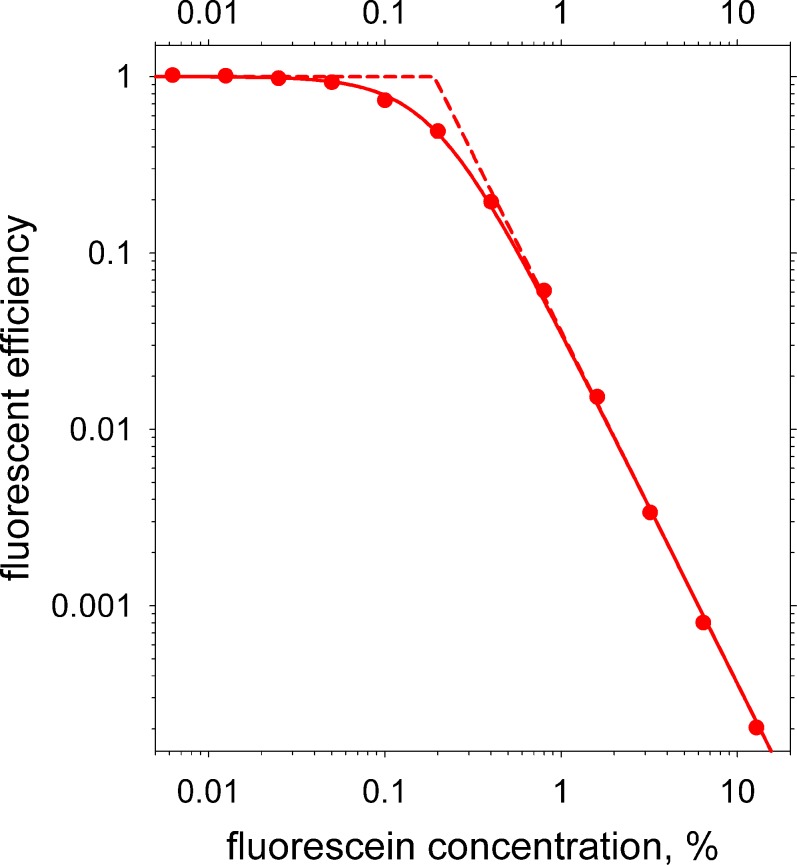
Figure A2. .
Filled circles are measured values of fluorescent efficiency as a function of fluorescein concentration (log scales). The solid curve is a least squares fit based on Equation A4 for RET. Dashed curves are the two asymptotes, which intersect at the “critical concentration” (c0 in Equation A4) of 0.19%.

