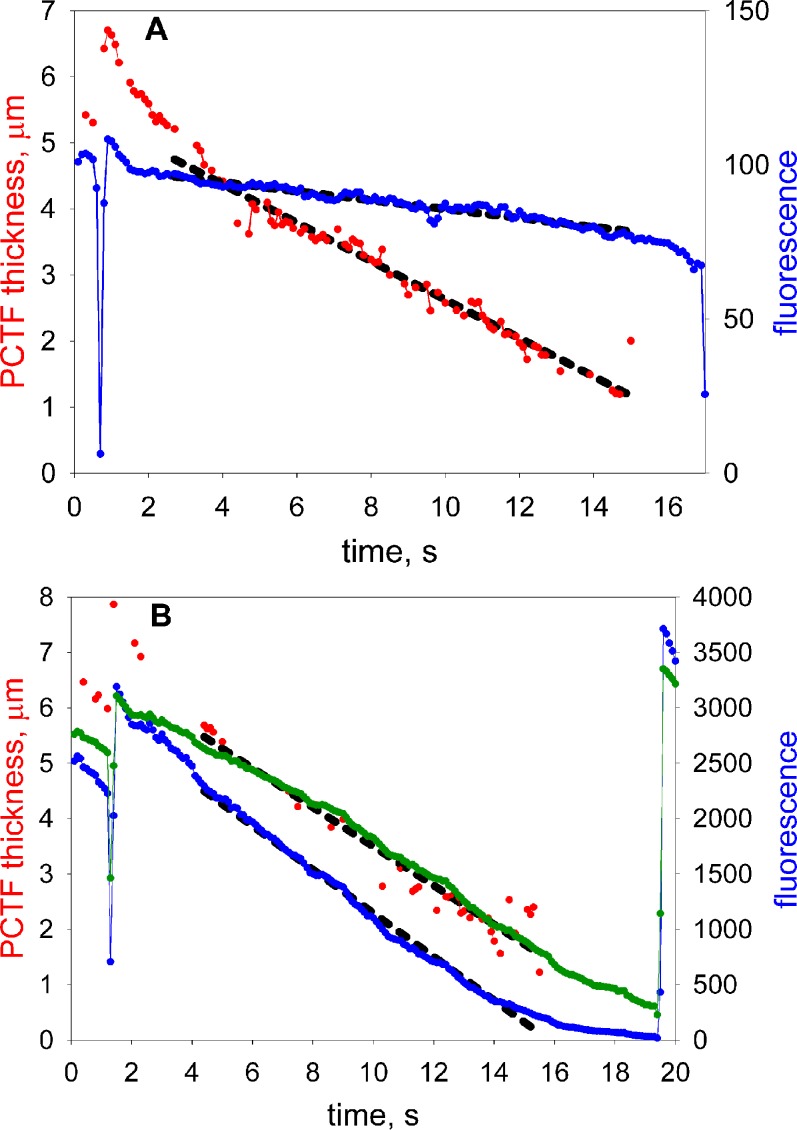
Figure 3. .
Tear film thinning and fluorescence measurements for one subject with (A) low and (B) high fluorescein concentrations. Red: tear thickness. Blue: fluorescent intensity. Black dashed lines: regression lines fitted to these data, starting 2 seconds after a blink. The timing of blinks is indicated by dips in the fluorescence response. The green curve in (B) is proportional to the square root of fluorescence (see text for discussion).

