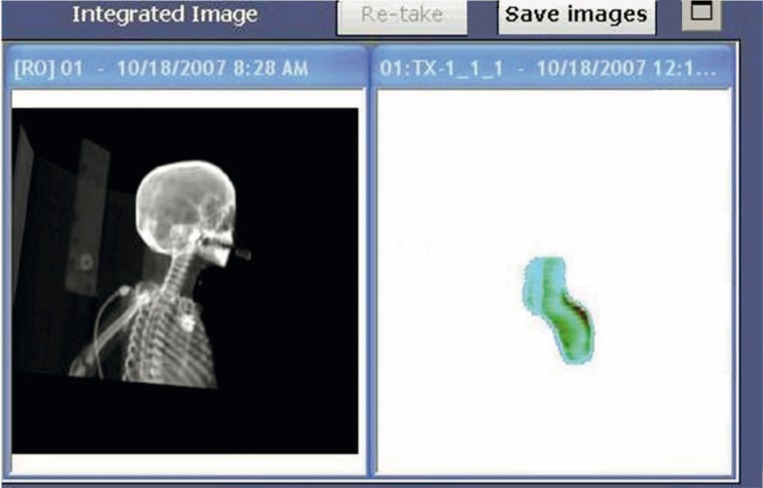
FIGURE 2.
Absolute dose image computed from the EPID response and the most recent calibration data for the appropriate energy and dose rate, as displayed by the delivery system computer upon acquisition. This image is exported from the delivery system treatment console computer to the TPS for comparison to the calculated portal dose prediction for the appropriate field and SSD.

