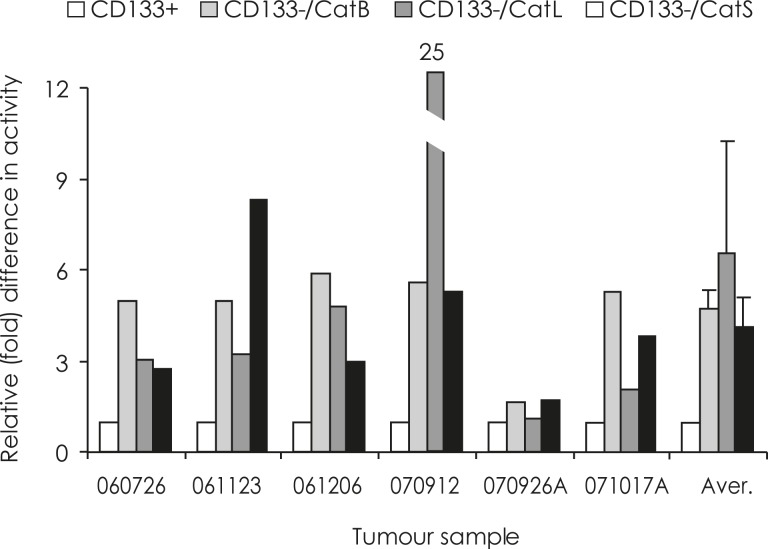
FIGURE 2.
Differences in cathepsins’ activities in CD133+ and CD133− cell fractions. In each of the six GBM samples, a relative activity of 1 was assigned to all the CD133+ cell fractions (white bars). Fold differences in activity of cathepsins between CD133− and CD133+ cell fractions were calculated as described in Material and Methods. CatB activity (light grey bars) was 1.7–5.9 times (average 3.9) higher, CatL activity (dark grey bars) 1.1–25 times (average 2.6) higher and CatS activity (black bars) 1.7–8.3 times (average 3.2) higher in the CD133− cell fractions than in CD133+ fractions.

