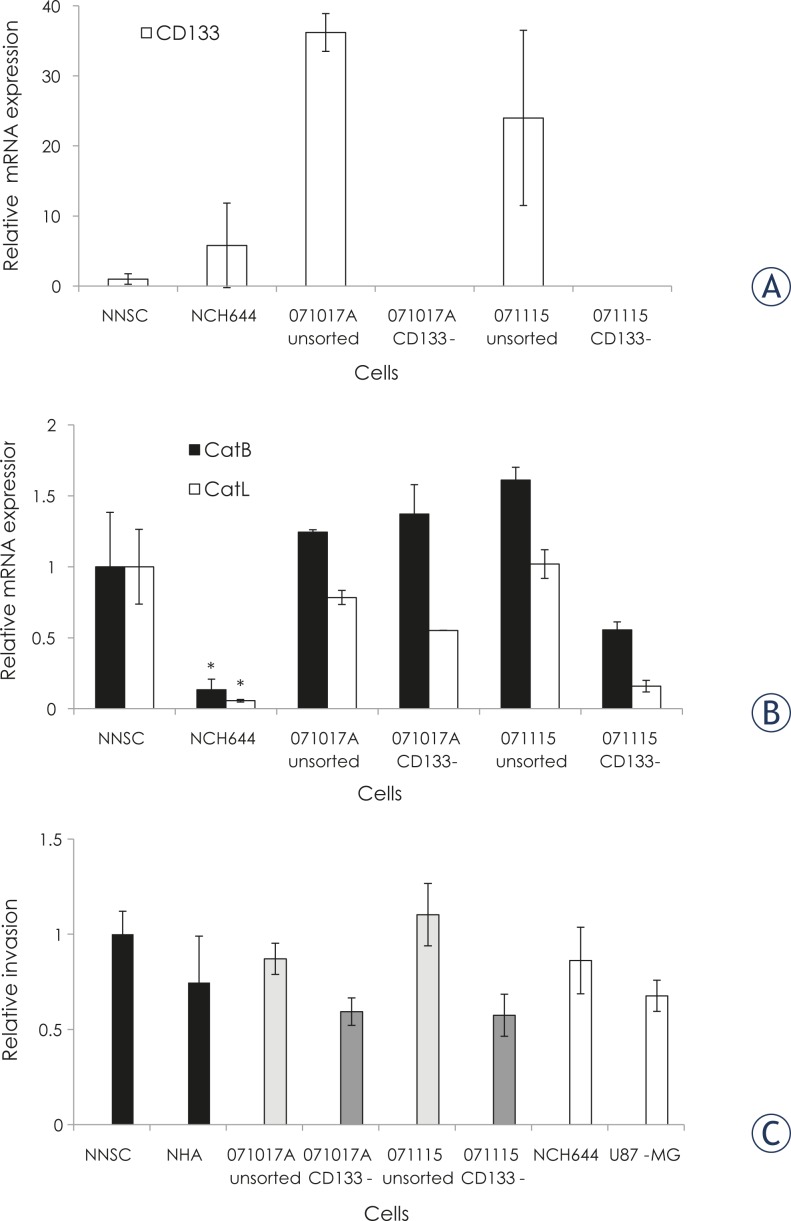
FIGURE 3.
Correlation between expression of cathepsins and 2D invasion in Matrigel. CD133 mRNA expression in vitro. CD133 mRNA expression was determined by QRT PCR in NNSC and NCH644 spheroids, and in unsorted GBM samples and in CD133− fractions from same GBM samples. A relative mRNA expression of 1 was assigned to NNSC. Cancer stem cells NCH644 cells were positive for CD133, however CD133 expression in (unsorted) GBM neurospheres was significantly higher (Student t-test, p<0.05) in spite of high variability between the three independent cell cultures, whereas in CD133− fractions from the same tumours, CD133 mRNA was below the detection limit. Cathepsin B and Cathepsin L mRNA expression in vitro. Cathepsin B and Cathepsin L mRNA expression was determined by QRT PCR in NNSC and NCH644 spheroids, and unsorted GBM samples and CD133− fractions from the same GBM samples. Relative mRNA expressions of 1 were assigned to NNSC. Cancer stem cells NCH644 cells expressed CatB and CatL at a significantly lower level than the NNSC (Student t-test, p<0.05). Two dimensional cell invasion. Two dimensional cell invasion of NNSC, NHA, unsorted GBM cells and CD133− GBM cell populations, NCH644 and U87-MG cells, into Matrigel was carried out as described in Material and Methods. The percentage of invasive cells in NNSC was adjusted to 1 and other values were expressed as invasion relative to NNSC cells. The high variability in three independent experiments is reflected by relatively high inter assay S.D. values, whereas within each experiment the S.D. was always less than 10 %.

