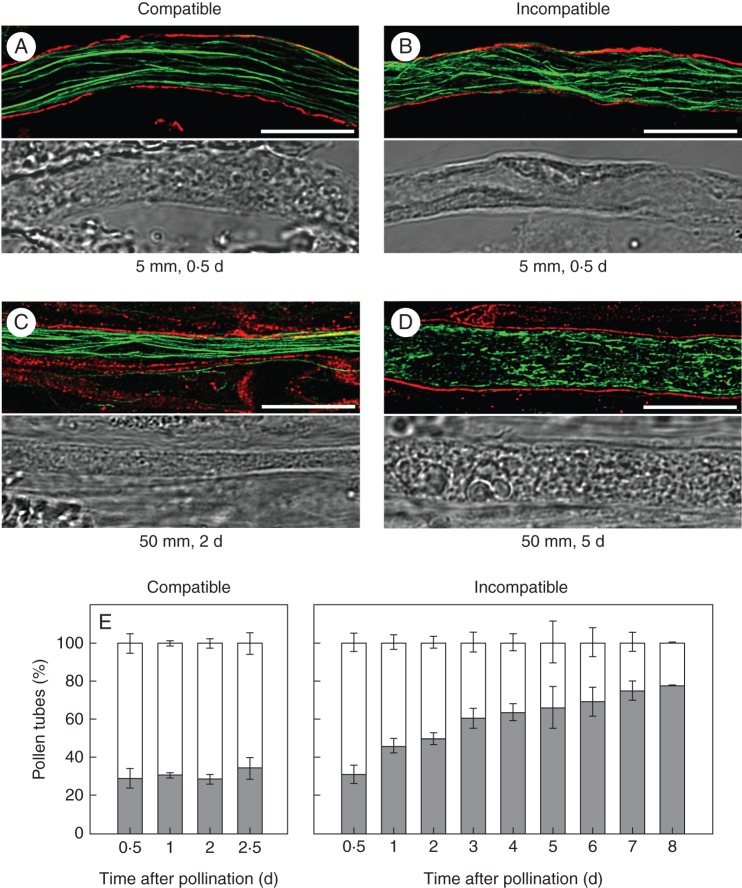
Fig. 3.
Changes in the F-actin cytoskeleton of pollen tubes during the in vivo SI response. Colocalization of F-actin (green) and callose (red) in compatibly and incompatibly pollinated pistils. (A–D) Confocal image stack of phalloidin-stained pollen tubes was merged to the middle optical section in which callose staining demarcates the boundaries of pollen tubes (top panels); the corresponding bright fields are shown in the bottom panels. The distances from the stigma and the times after pollination are indicated below the images. Scale bar = 10 µm. (E) Quantification of F-actin morphology in compatible and incompatible pollen tubes. White, Organized actin; grey, disorganized actin. At least 75 pollen tubes were examined in each experiment. The values are the average ± s.d. for two or more independent experiments.

