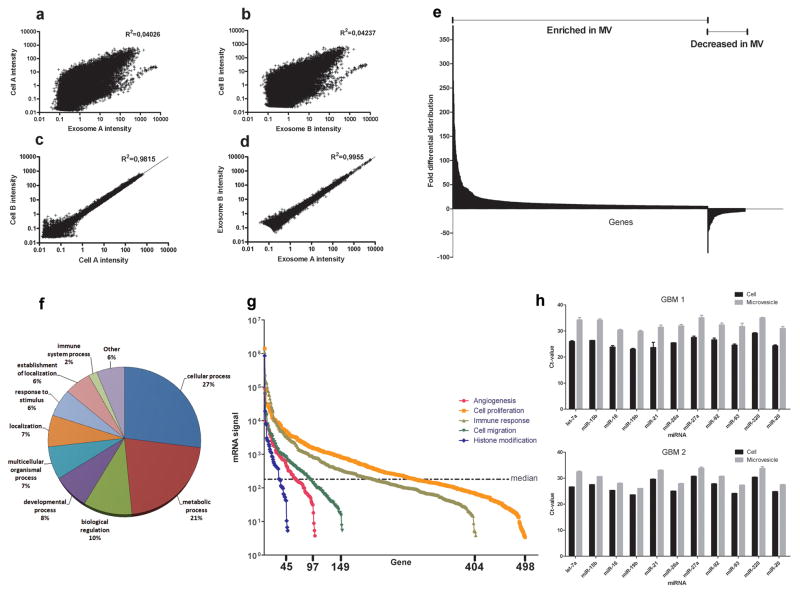
Figure 2. Characterization of the microvesicle RNA.
(a, b) Scatterplots of mRNA levels in the microvesicles compared to donor cells from two different experiments. Linear regressions showed that levels in cells versus microvesicles were not well correlated. (c, d) In contrast, mRNA intensities in two different cell or two different microvesicle preparations were closely correlated. (e) 3426 genes were found to be more than 5-fold differentially distributed in the microvesicles as compared to the cells from which they were derived (p-value <0.01). (f) The biological process ontology of the 500 most abundant mRNA species in the microvesicles is displayed. (g) The intensity of microvesicle RNAs belonging to ontologies related to tumor growth is shown with the x-axis representing the number of mRNA transcripts present in the ontology. The median intensity levels on the arrays were 182. (h) Levels of mature miRNAs in microvesicles and glioblastoma cells from two different patients (GBM1 and GBM2) were analysed using quantitative miRNA RT-PCR. The cycle threshold (Ct) value is presented as the mean ± SEM (n = 4).

