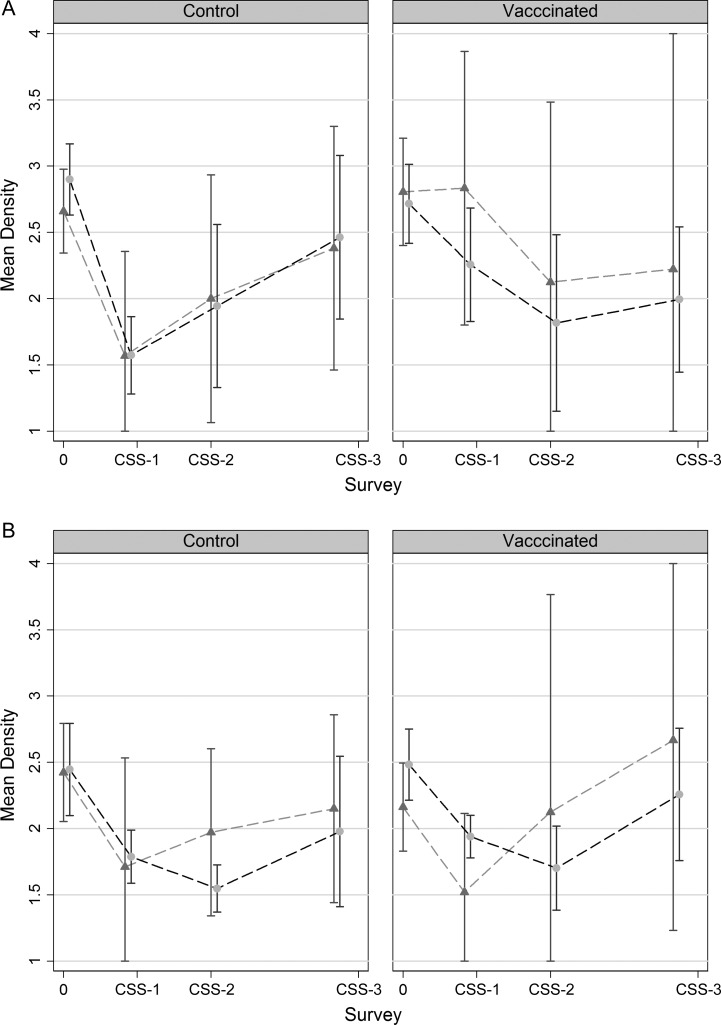
Figure 3.
Mean density of vaccine-type (triangles) and non–vaccine-type (circles) pneumococcal carriage at prevaccination (0) and at 3 postvaccination surveys (CSS-1 to CSS-3). Capped lines represent 95% confidence intervals. A, Children ≤5 years of age when the sample was collected. B, Individuals >5 years of age when the sample was collected. Abbreviation: CSS, cross-sectional survey.

