
Fig. 9.
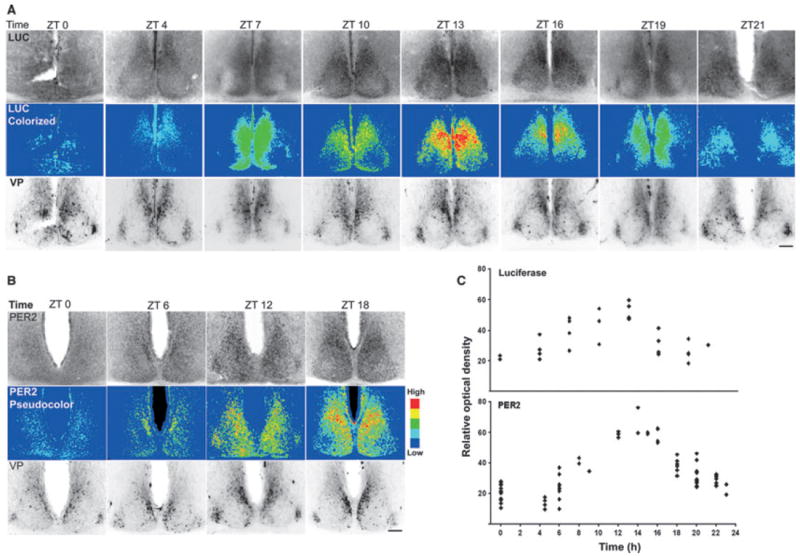
(A) Time-course of LUC expression of PER2:LUC transgenic mice in vivo. First row shows microphotographs of the SCN immunostained for LUC. Middle row shows the same images as in top row, pseudocolored to facilitate comparison of LUC expression in Figs 2 and 3. Bottom row shows the same sections double-labeled with VP to delineate the mid-SCN, ensuring that similar regions were examined across animals. (B) Time-course of PER2 expression in C57BL/6 mice in vivo. As in A, the first row shows PER2 expression, middle row shows the same images pseudocolored and bottom row shows VP staining. Overall, the immunochemical staining corresponds well with bioluminescence seen in slices 1 and 2 (Figs 3 and 4). (C) Graph showing ROD of LUC and PER2-ir in each unilateral SCN throughout the cycle. Scale bars, 100 μm.