
Figure 3. Podosomes and Invadopodia in 2-dimensions.
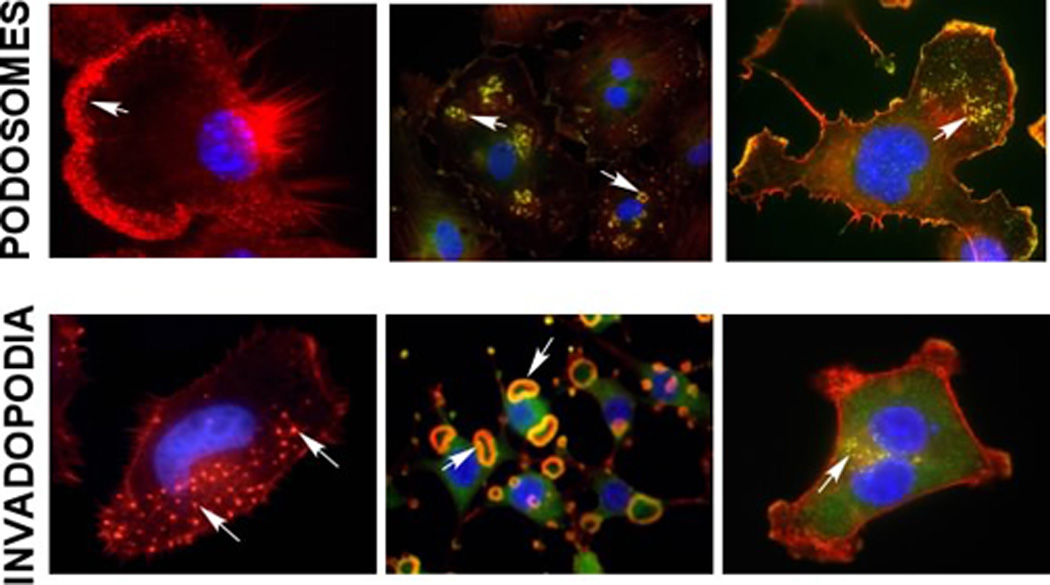
Formation of podosomes and invadopodia is frequently visualized by co-staining cells with F-actin (red) and the podosome and invadopodia associated protein cortactin (green). These structures can be seen in many cell types. Podosomes (top row): Macrophages (IC-21), vascular smooth muscle cells (VSMCs - A7r5 treated with 25nM PDGF) and neural crest stem cells (JOMA1.3, treated with 20nM PMA). Invadopodia (bottom row): head and neck squamous carcinoma cells (SCC61), Src-3T3 cells, and breast cancer cells (MDA-MB-231). Arrows denote podosomes and invadopodia.