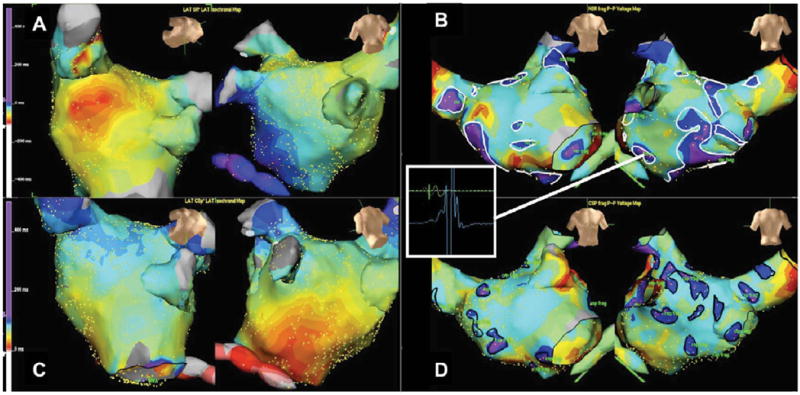
Figure 1.

Activation and CFAE maps in Sinus Rhythm and during CS pacing in the same left atrium. A&C demonstrate the high density of points (>700 points/map in this patient) taken and the activation map thus created in SR and during CS pacing respectively. Figures B&D demonstrate CFAE maps in SR and CS pacing respectively. The colour scales in maps (B) and (D) reflect the number of deflections of the electrogram from baseline. CFAE are in dark blue and purple (>4 and >5 deflections respectively). Regions of CFEA thus identified are ringed in markers (SR = white, CSp = black). Note the different distribution of fractionation during SR and CS pacing at similar heart rates.
