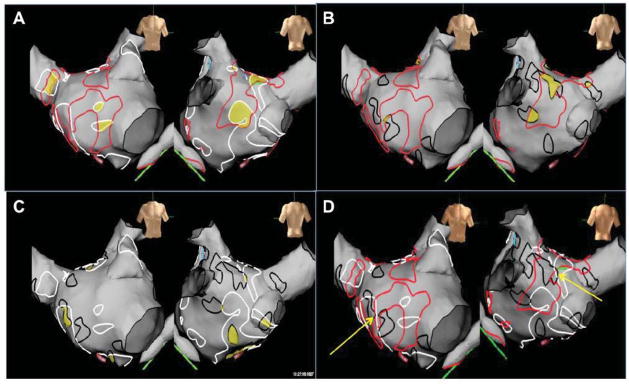
Figure 3.
Correlation of CFAE distribution during atrial fibrillation, sinus rhythm and CS pacing. High density CFAE map recorded in the same patient as Figure 1. (A) Comparison of regions of CFAE in AF and SR. (B) Comparison of regions of CFAE in AF and CS paced rhythm. (C) Comparison of CFAE distribution in SR and CS paced rhythm. (D) Comparison of all three rhythms. Continuous CFAE sites in AF were marked in red, electrogram fractionation in SR and during CS-pacing in white and black respectively. Overlapping CFAE sites between different rhythms are highlighted as yellow areas. Mean overlap of CFAE areas in [AF + SR] and [AF and CS-p] were only 15+/−5% and 18+/−7% of the total CFAE area in AF, respectively. Only 27+/−9% of LA sites show fractionation during both SR and Cs-pacing (yellow areas in C). Less than 5% of the total LA surface area was fractionated in both AF and SR. A negligible amount of the left atrium appeared fractionated in all three rhythms. In the current case areas appear to border each other but not overlap (areas highlighted by yellow arrows (D)).

