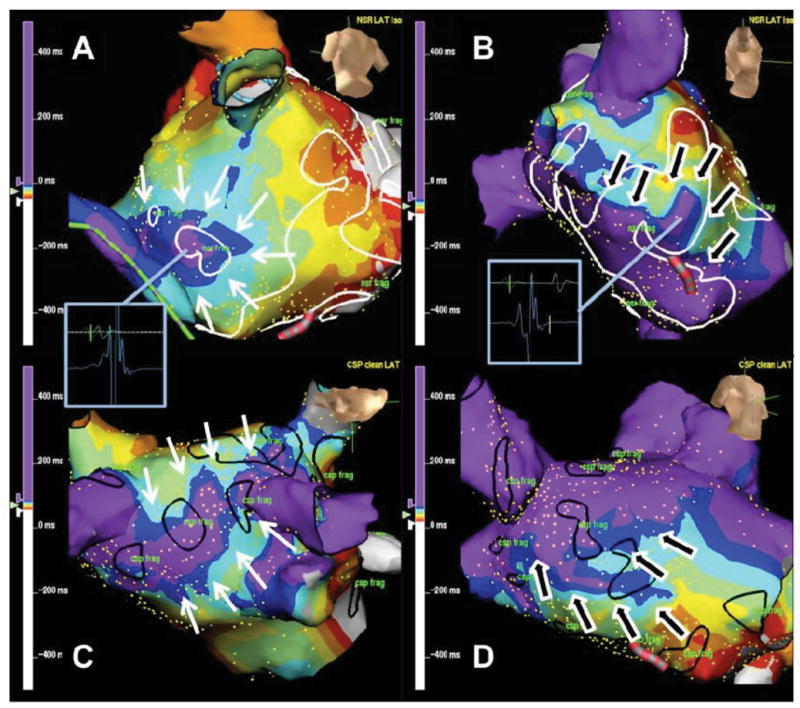
Figure 4.

Isochrone activation map of the left atrium during SR and CS pacing characterising mechanisms of fractionation. Figures A&C demonstrate examples of ‘wavelet collision’ during SR and CS pacing respectively. White arrows highlight the direction of waves of depolarisation that collide at areas of fractionation. In Figures B&D depolarisation is seen to wrap around a zone of slow conduction (black arrows) resulting in ‘dyssynchronous’ activation of that region corresponding to an area of fractionation. Regions of fractionation in SR are outlined with white markers (upper panels), CS paced in black (lower panels).
