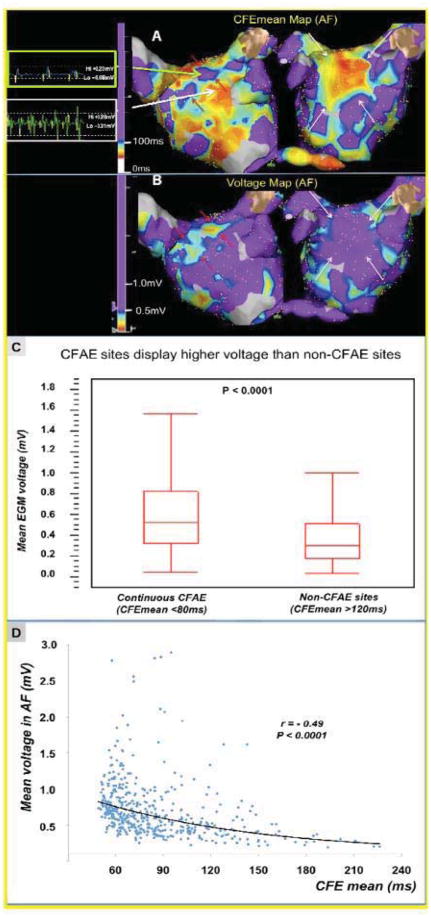
Figure 5.
Correlation of degree of electrogram fractionation with mean bipolar voltage during AF. CFAE (A) and Voltage (B) maps of the same left atrium taken during AF. Typically areas without fractionation correspond to sites of reduced voltage (<0.5mV) surrounding CFAE sites in Panel A and B (red arrows; green arrow shows a representative low voltage EGM surrounding anterior CFAE site). Conversely, the large area of CFAE on the anterior wall demonstrated higher voltage electrograms (>0.5mV; large white arrow shows representative EGM). (C) Quantitative analysis of > 2800 EGs (CFAE maps in AF, recording time 8 seconds) in the PsAF patients. Continuous CFAE sites (CFEmean <80ms) display higher bipolar voltage during AF than non-CFAE sites (CFEmean>120ms) (median: 0.53mV (IQR: 0.33–0.83) vs. 0.30 mV (IQR: 0.18–0.515, respectively, p<0.00001). (D) Example of inverse correlation between CFEmean interval (surrogate of fractionation in AF) and mean EG voltage in a patient with persistent AF (r= −0.49, p<0.0001).

