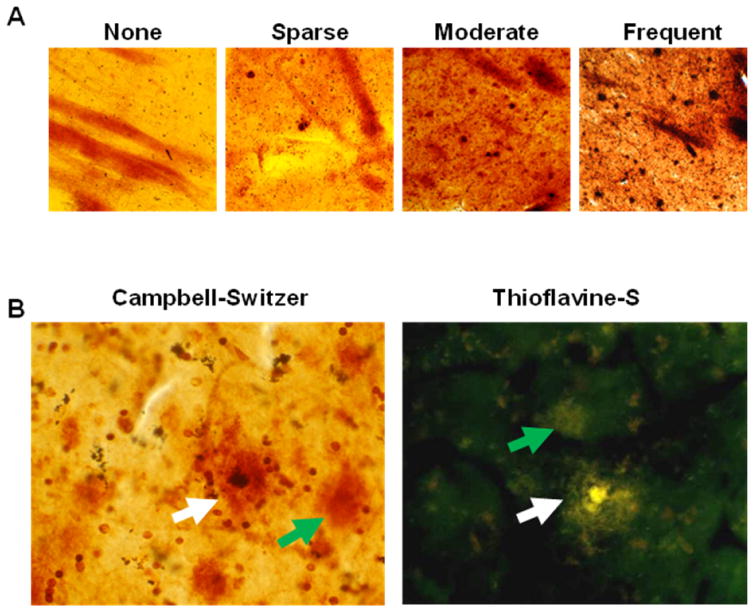
Figure 1.
A) Representative images taken at 10× magnification of plaque density scores in the putamen of none (0), sparse (1), moderate (2) and frequent (3), according to the published CERAD criteria [1]. B) Representative images taken at 40× magnification of neuritic (white arrow) and diffuse plaques (green arrow) with Thioflavine-S and Campbell-Switzer staining.

