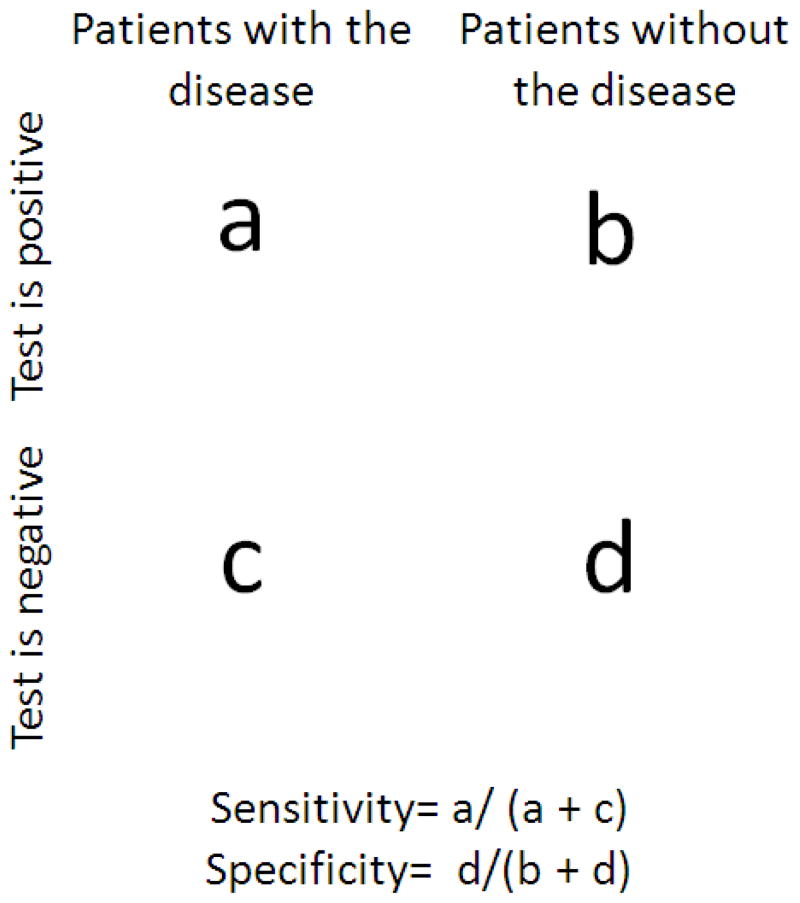
Figure 2.
Diagram of how sensitivity and specificity were determined. Sensitivities were calculated by dividing the number of cases containing a positive test (i.e. specified plaque measure) and patients with the disease (i.e. AD or dementia) - a in the figure above) by the total number of cases having the disease diagnosis regardless of test outcome (a + c). Specificities were calculated by dividing the number of cases having a negative test (i.e. lacking the specified plaque measure) and without the disease (i.e. no AD or dementia) - d in the figure above and by the total number of cases lacking the disease regardless of test outcome (b + d).

