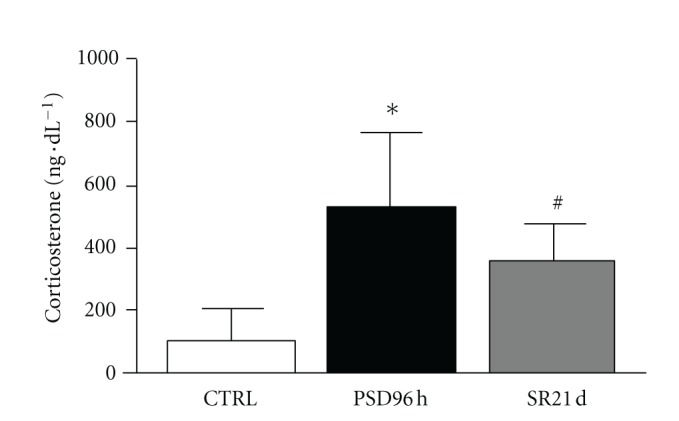
Figure 2.

Mean ± SD concentration of plasma corticosterone (in ng dL−1) of control group (CTRL), sleep deprivation (PSP), and sleep restriction (SR) at different time points. *Different from all groups (P < 0.01); #different from control group (P < 0.01).
