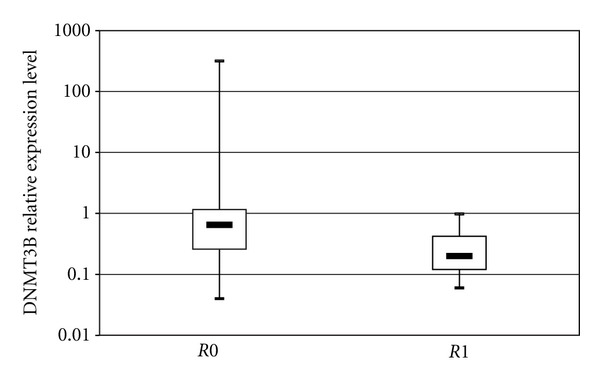
Figure 3.

Association of DNMT3b expression levels with resection margins in patients with pancreatic ductal adenocarcinoma (PDAC). Patients were stratified according to resection margin status (R0 versus R1). Each box highlights median, interquartile range (Q1–Q3) and lower and upper adjacent values (vertical bars) for each subjects group. The upper and lower boundaries of the boxes define the quartiles, 75% and 25% percentiles, respectively, and the black bar represents the median value. Relative expression values are reported in log scale (y-axis).
