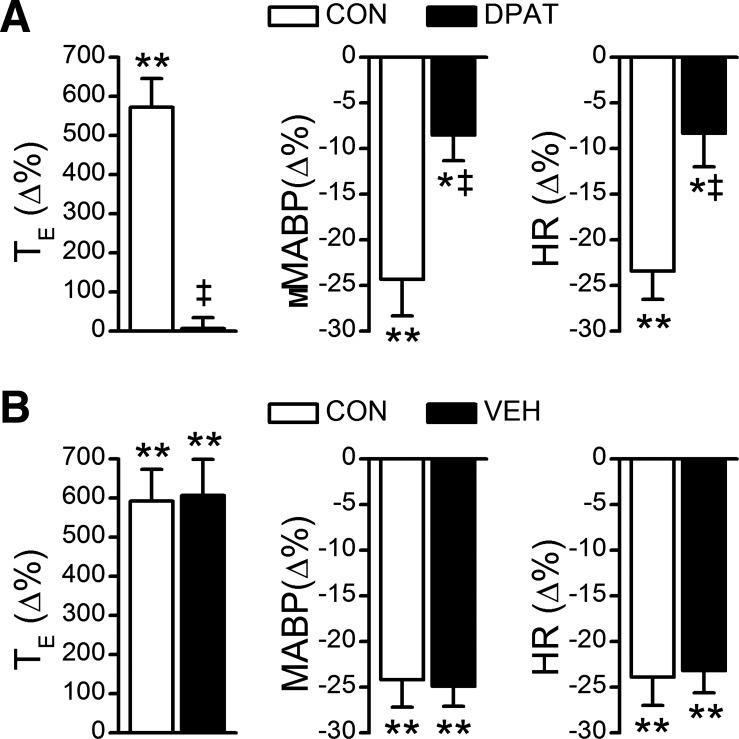
Fig. 4.
Fentanyl-induced TE prolongation and cardiovascular responses before and after intravenous administration of DPAT (A) or vehicle (VEH, B). n = 9; values are means ± SE; *P < 0.05 and **P < 0.01, compared with the baseline values (before injecting fentanyl into the right atrium); ‡P < 0.01, compared with CON (before systemic DPAT challenge).

