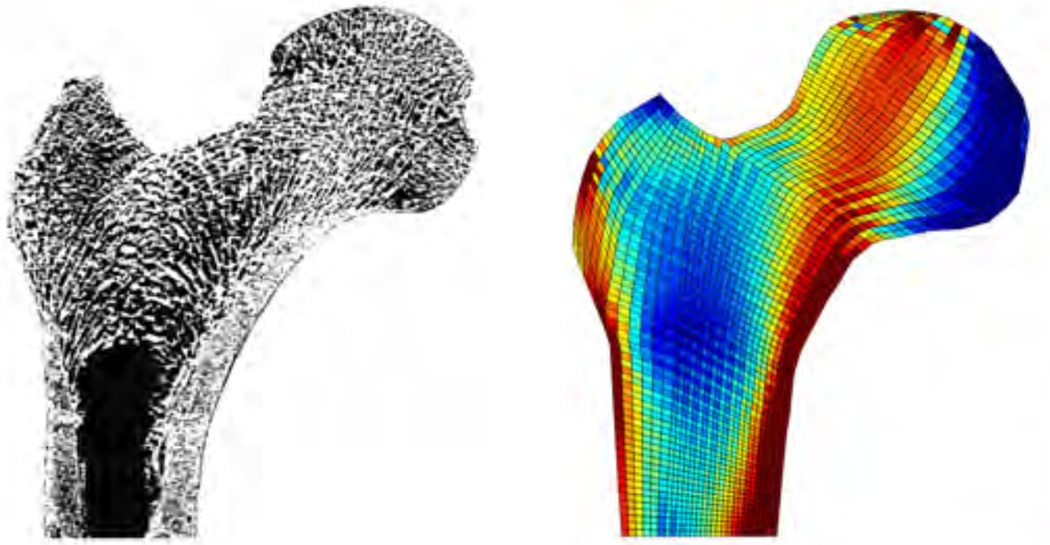
Figure 4.
Density growth of the proximal femur for an energy-driven mass source, ρ̇0 = R0 with , according to equations (17) and (39). Photograph of a thin section, left, demonstrates microstructural arrangement of trabeculae in the femur head aligned with the axis of maximum principal stress [112]. Computational simulation of density growth, right, predicts higher bone densities in regions of large mechanical stress and lower bone densities in unloaded regions [64, 65].

