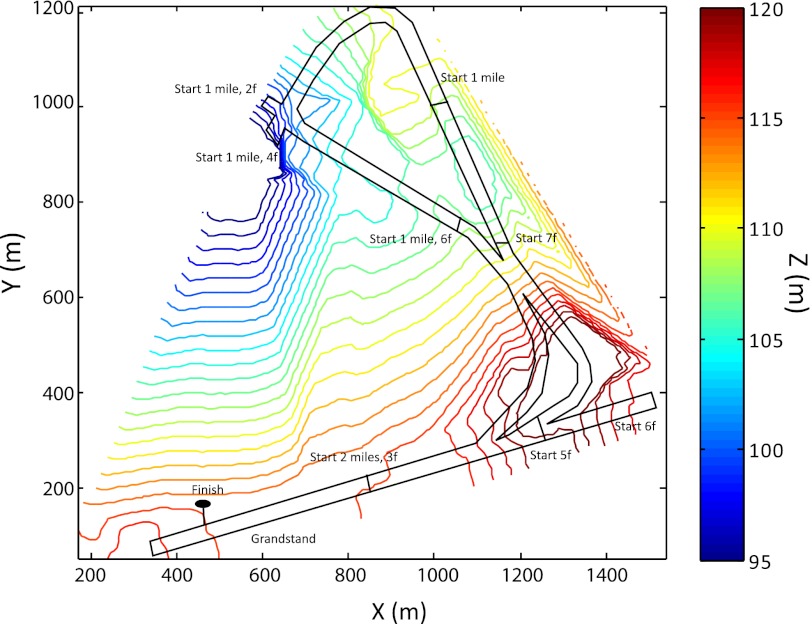
Fig. 1.
Contour plot of Goodwood racecourse. Racetrack is overlaid onto a contour plot from GPS survey. Color represents vertical height whereas spacing of the contour lines indicates gradient. Race start positions for races of different lengths (in miles and furlongs) are indicated, with all races finishing at the same point in front of the grandstand. One furlong is approximately equal to 201 m.

