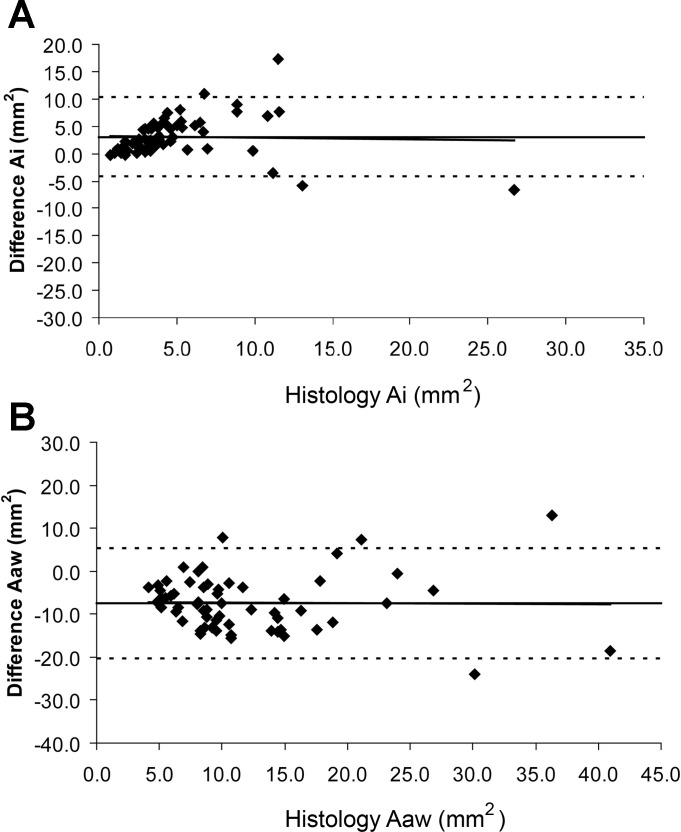
Fig. 3.
A: Bland and Altman plot of the mean airway lumen area (Ai in mm2) measured histologically vs. the difference between the CT measurements and the histological measurements (Ai CT − Ai micro in mm2). B: Bland and Altman plot of the mean airway wall area (Aaw − mm2) measured histologically vs. the difference between CT and histology measurements (Awa CT − Awa micro mm2) in B. Horizontal solid line represents the mean difference between CT and histology while the interrupted line indicates plus and minus two standard deviations of the difference. Line of best fit for the data is also included and is almost identical to the mean difference line.

